Tony Roylance for Seeking Alpha writes: "The art of prophecy is difficult, especially with respect to the future." - Mark Twain
As most of you know, I focus most of my research on developing tactical investing strategies that follow the major market indexes specifically, the S&P 500 large cap index (SPY), the S&P 400 midcap index (MDY), and the Russell 2000 small cap index (IWM). Mutual funds or annuities that track these indexes are present in almost all 401k plans, and an individual investor can implement an effective strategy using these 3 indexes alone.
Tactical Investing
Let's start with what tactical investing is not. Tactical investing is not "market-timing". Tactical investors make absolutely no predictions about what the market is going to do. George Soros in his book The Alchemy of Finance states, "My financial success stands in stark contrast with my ability to forecast events…all my forecasts are extremely tentative and subject to constant revision in the light of market developments."Tactical investing focuses on what the market is doing at the present time. That means, we buy when the market has turned up after a correction, but before it has risen too far-and we sell when the market turns down, but before it has declined too much. We attempt to be invested in an appropriate asset allocation in the direction of the primary trend. The asset allocation is going to be dependent on your own risk tolerance and investment duration.
There are several different paths investors can take to reach the same destination. "Buy and Hold" is a perfectly acceptable investment strategy, purchasing quality companies at a discount and holding them until their true value is realized. Unfortunately, "Buy and Hold" didn't work for me. I would buy quality companies at a discount, but they would become even more discounted-and then even more. I couldn't stand watching my account dwindle until I finally couldn't take it anymore and sold. I had to find another way of investing in the market and began my quest 16 years ago.
The earlier you choose one that is most in sync with your belief system, and have the discipline to stick with it, the better off you'll be. An investor can choose anything from Ben Graham's long-term valuation techniques, to buying high-yielding stocks, to buying strong stocks with virtually no yield. Numerous techniques can make money in the market, you must choose the one that is most agreeable to you to have the discipline to follow it.
Implementing in a 401k
The 401k retirement plan is the primary vehicle that most Americans will use to fund their retirements. Americans have been told by Wall Street that if they contribute enough money to their plans over a long enough time period, that there should be enough money for them to retire. Once or twice a year, you may have a meeting with your "financial guy", who will put your information into a financial program that will estimatewhether or not you will have enough money to retire at a certain age. If the program estimates a shortfall, you have 3 choices, 1) increase your contribution, 2) work past your anticipated retirement age, or 3) lower your expectations for the type of retirement you envision. None of those options are very pleasant. What if there was another way? What if there was a way that we could generate a greater return in retirement plans? If we are using a tactical model to assist in limiting risk, then when we are invested we can choose investments that provide a greater return. We can also use a tactical model to assist us in investing our deferrals.
Top Down Approach
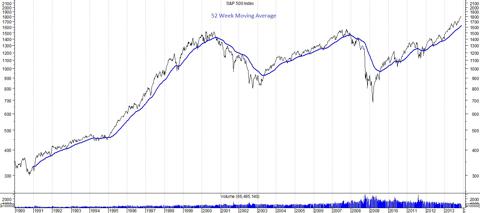
401k's almost always have a limit on the number of transactions that participants can do per quarter or per year. We must design our model so that it trades less than a dozen times a year. I must also design a model so that readers of Seeking Alpha that don't have access to sophisticated charting programs can also use it. Price is the most important variable in any trading model, and the moving average is commonly used to gauge the strength or weakness of price. In this case, I have the S&P 500 on a weekly timeframe starting January 5, 1990 until November 29, 2013. Investors can use a very simple basic trading strategy of buying when the S&P 500 closes above its moving average, and selling when it goes below. I have run a test to find the optimum number of weeks to use for the moving average. In this case, it is 52 weeks, 1 year.
The most striking thing is that this simple moving average test did not significantly beat a buy and hold investor, especially once you factor in transaction charges and fees. What the simple moving average excels at, is limiting risk and limiting loss. When applying a long-term moving average, you are essentially adding protection to your retirement account. Your risks of being invested in the middle of a devastating bear market are greatly reduced. The cost of that protection, or premium if you will, is going to be a number of "whipsaws" and false signals. Personally, that is a cost I'm willing to pay.
We don't want all our eggs in one basket
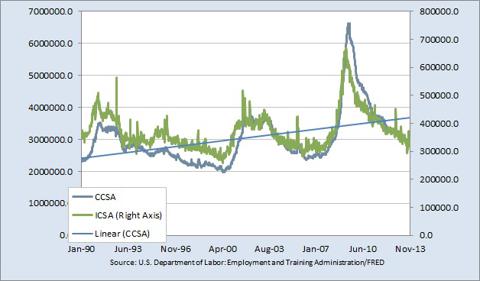
Price is very important, but for proper interpretation we must also look at it in a broader context. Let's add an economic measure as well. There are literally hundreds of economic data series that I have looked at in my analysis of the market. One of the closest I watch, predominantly because the Fed watches it too is the employment situation. When the economy is growing, more people have jobs and fewer are laid off. Alternatively, when the economy is contracting, fewer people have jobs and more are laid off. People who are out of a job usually apply for unemployment insurance. By watching the number of people applying for unemployment insurance, both initial claims and continuing claims, we can quickly monitor the overall economic condition. I have also plotted a linear regression of the continuing claims number since 1990. This chart demonstrates that both continuing claims and initial claims for unemployment are falling, and below a linear regression line. Both of these are signs of underlying economic growth.
Finally
First we developed a long-term average that we have tested and found it to have gotten us out of both of the previous bear markets. Using this, we can limit our risk and while not getting us out of smaller corrections, may hopefully get us out of the market before a truly devastating bear market hits.
Next, we used an economic indicator confirm the moving average signal. If the economic indicator is showing a sharp rise in initial claims or continuing claims, that would be a time to be cautious and perhaps move into more conservative investments.
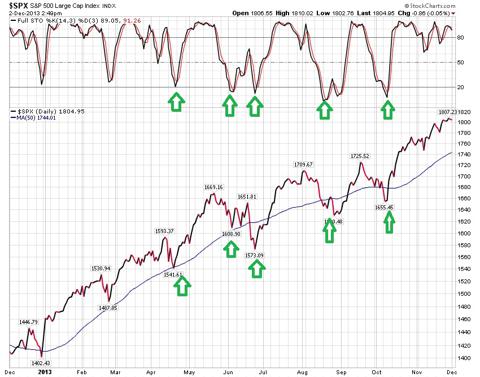
Finally, when we are contributing our deferrals into our accounts, we can watch another indicator to tell us the optimum times to contribute.
Look again at the long-term moving average chart at the top, the last signal was a 'BUY' signal from November 23, 2012. Using the stochastics oscillator with the default settings 14, 3, 3 - we can demonstrate the optimal buypoints for you to add money to your 401k.
Following this indicator, you are fulfilling the first half of being successful in the market, "buying low".
Combining a long-term strategy with both price and economic inputs, and then using a short-term technical indicator to tell us optimal buy points will go a long way to make you a more effective long-term investor. Using these strategies should greatly enhance your returns, limit your risks, and hopefully make you sleep more soundly at night.
This is a very simple basic system that any investor can use to allocate money over time into their retirement plan. If anyone would like to communicate further on trading strategy development, feel free to message me.


0 comments:
Post a Comment