John Dowdee for Seeking Alpha writes: Constructing A High-Income, Tax-Exempt Portfolio With CEFs
Summary
- A portfolio of municipal bond CEFs is a compelling way to receive high tax-exempt income.
- Municipal bond CEFs have provided excellent risk-adjusted returns over the long term, but faltered last year.
- Municipal bond CEFs have outperformed similar ETFs on a risk-adjusted basis during the past 5 and 3 years periods.
As a retiree I am always looking for high income opportunities. Most of my portfolio is held in an IRA account so I do not have extensive experience with municipal bonds. However, I understand that many retirees have taxable account and I have received several requests to analyze the risk versus rewards of this asset class. This article reviews several popular municipal bond Closed-end funds (CEFs) to determine their relative performance in terms of risk-adjusted return.
Municipal bonds are issued by local governments and associated agencies including state, cities, counties, public utilities, school districts and redevelopment entities. The bonds may be general obligations (not tied to a particular income stream) or bonds secured by specific revenues. Typically municipal bonds are exempt from Federal Income tax and some may also be exempt from state taxes. This makes this asset class attractive to investors in higher tax brackets.
It should be noted that if municipal bonds are sold to finance "private activities" such as airports and some housing agencies, these bonds may be subject to the Alternative Minimum Tax (AMT). AMT is a special way to compute taxes by eliminating some deductions and credits. The bonds associated with AMT typically pay higher yields to compensate the buyer for the potential taxable risk.
Historically, municipal bonds have a low rate of default but municipalities have been in a difficult position since the 2008 financial crisis. Some of the rating agencies issued "negative outlooks" on some municipalities in 2013, which, coupled with the potential for higher interest rates, resulted in a sell-off of muni-related assets in 2013. The filing for bankruptcy by Detroit, Michigan, also has a chilling effect. Closed-end funds (CEFs) were hit even harder due to their use of leverage and price discounts generally widened. The market is expected to improve this year so now may be a good time to consider this asset class.
Another important metric when investing in bonds is an assessment of the effective duration. Duration is a term that helps you to understand the interest rate risks. Duration is different than the maturity - maturity indicates how long a bond will be in existence. For instance, if you buy a 10-year bond, the principal will be repaid at the end of 10 years and the maturity is said to be 10 years. Duration is a more complicated concept. Mathematically, duration is a complex formula that represents the weighted average of the time it takes the cash flow from the bond (including the final par value payment) to reimburse the price of the bond. If a bond pays interest at set intervals, the duration is always less than the maturity.
Most bond funds provide an estimate of the average duration of their holdings so investors do not need to know how to calculate this metric. The important thing to understand is that duration is a measure of how sensitive the fund is to interest rate changes. For each 1% rise in interest rates, a bond fund will typically decline an amount equal to the average duration (or vice versa, the fund will increase in value by the average duration if interest rates fall 1%). As an example, if a fund has a duration of 5 years and interest rates rise by 1%, then you would expect the value of the fund to decrease by 5%. If a fund uses leverage, this will increase the effective duration. The change in price may not exactly track with the duration (there may be other factors at work) but duration is a good indication of interest rate risk.
There are approximately 100 CEFs that invest in municipal bonds. To narrow down the scope of my analysis, I selected only municipal funds that were rated "bronze" or better by Morningstar. Morningstar provides a comprehensive fundamental analysis of bond funds and the "bronze" rating means that the Morningstar staff expects the fund to outperform its peer group over the next five years. In addition, I only considered funds that were national in scope and not limited to a particular state. The following nine CEFs met my criteria.
- BlackRock Muni Intermediate Duration (MUI). This CEF sells for a discount of 9.3%, which is below the 52-week average discount of 6.5%. The portfolio consists of 251 intermediate-duration municipal bonds and related securities. The effective duration is 8.6 years, which makes this fund less sensitive to interest rates than other longer duration CEFs. About 92% of the bonds are investment grade and about 16% of the holdings are subject to the Alternative Minimum Tax. The fund utilizes 39% leverage and has an expense ratio of 1.9% including interest payments. The distribution rate is 5.8%.
- BlackRock Municipal Income (BFK). This CEF sells for a discount of 5.9%, which is below its average discount of 2.9%. the portfolio consists of 218 municipal bonds and related securities, with an effective duration of 10.2 years. About 80% of the holdings are investment grade and 11.3% are subject to AMT. The fund utilizes 40% leverage and has an expense ratio of 1.7%, including interest payment. The distribution rate is 6.8%.
- BlackRock Municipal Income II (BLE). This CEF sells for a discount of 4.1%, which is below its average discount of 1.3%. The portfolio consists of 211 municipal bonds and related securities with an effective duration of 10.9 years. About 80% of the holdings are investment grade and 9.6% are subject to AMT. The fund utilizes 42% leverage and has an expense ratio of 1.7% including interest payments. The distribution is 7%.
- BlackRock MuniHoldings Investment Quality (MFL). This CEF sells for a discount of 9%, which is below its average discount of 6.6%. The portfolio consists of 162 municipal bonds and related securities, with all being investment grade and 96% being AA or higher. In addition, about a third of the holdings are covered by insurance. The effective duration of the portfolio is 9.4 years and 12.5% of the holdings are subject to AMT. The fund utilizes 43% leverage and has an expense ratio of 1.7% including interest payments. The distribution is 6.4%.
- BlackRock MuniVest (MVF). This CEF sells for a discount of 4.2%, which is below its average discount of 1.2%. The portfolio consists of 185 municipal bonds and related securities, with 93% being investment grade (71% rated AA or higher). The effective duration is 9.0 years and 11.9% of the portfolio is subject to AMT. The fund utilizes 40% leverage and has an expense ratio of 1.5% including interest payments. The distribution is 7.1%.
- BlackRock MuniVest II (MVT). This CEF sells for a 2.3% discount, which is below the average premium of 0.2%. The portfolio consists of 218 municipal bonds and related securities, with 86% being investment grade (70% AA or higher). The effective duration is 9.9 years and 9.2% of the portfolio is subject to AMT. The fund utilizes 41% leverage and has an expense ratio of 1.7% including interest payments. The distribution is 7.1%.
- BlackRock MuniYield (MYD). This CEF sells for a 4.8% discount, which is below its average discount of 2.3%. The portfolio consists of 249 holdings of municipal bonds and related securities, with 85% being investment grade (55% AA or higher). The effective duration is 10.4 years and 9.6% of the portfolio is subject to AMT. The fund utilizes 40% leverage and has an expense ratio of 1.5% including interest payments. The distribution is 7%.
- BlackRock MuniYield Quality (MQY). This CEF sells for a discount of 6.7%, which is below its average discount of 4.1%. The portfolio consists of 245 municipal bonds and related securities, with 95% being investment grade (86% AA or higher). About half the portfolio is covered by insurance. The effective duration is 9.9 years and 16.8% of the portfolio is subject to AMT. The fund utilizes 40% leverage and the expense ratio is 1.5% including interest payments. The distribution is 6.6%.
- BlackRock MuniYield Quality II (MQT). This CEF sells for a discount of 7.4%, which is below its average discount of 6.7%. The portfolio consists of 234 municipal bonds and related securities, with 97% being investment grade (89% AA or higher). About half the portfolio is covered by insurance. The effective duration is 9.8 years and 14.2% of the portfolio is subject to AMT. The fund utilizes 40% leverage and has an expense ratio of 1.5%. The distribution is 5.7%.
- BlackRock MuniYield Quality III (MYI). This CEF sells for a discount of 6.5%, which is below its average discount of 5.2%. The portfolio consists of 284 municipal bonds and related securities, with 96% being investment grade (92% AA or higher). The effective duration is 9.6 years and 16.9% of the portfolio is subject to AMT. About half the portfolio is covered by insurance. The fund utilizes 40% leverage and has an expense ratio of 1.4% including interest payments. The distribution is 6.5%.
To analyze risks, I used the Smartfolio 3 program (smartfolio.com). Figure 1 provides the rate of return in excess of the risk-free rate of return (called Excess Mu on the charts) plotted against the historical volatility over the past five years. I also included the following Exchange Traded Funds (ETFs) to provide a frame of reference.
- iShares Barclay 7-10 Year Treasury ETF (IEF). This ETF tracks an index of U.S. treasury bonds that have maturities between 7 and 10 years. The effective duration is 7.6 years. The expense ratio is 0.15% and the yield is 1.8%.
- iShares National AMT-Free Muni Bond (MUB). This ETF is one of the largest and most liquid municipal bond ETFs. It holds more than 2,000 bonds, with 97% investment grade (68% AA or higher). It has an effective duration of 6.6 years and an expense ratio of 0.25%. The yield is 3%.
(click to enlarge)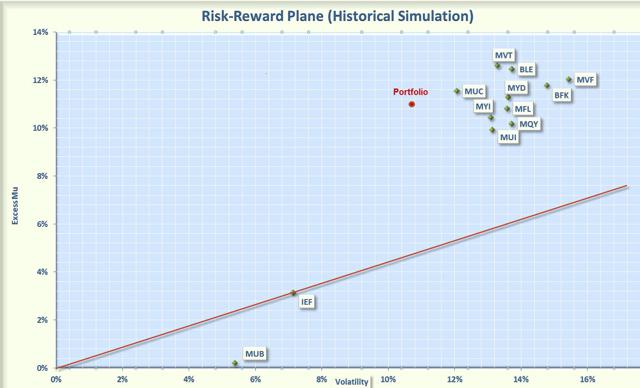
Figure 1: Risk Versus Reward Municipal CEFs Past 5 Years.
Figure 1 indicates that there has been a wide range of returns and volatilities associated with municipal bond funds. For example, MVF had a relatively high return but also had a high volatility. Was the increased return worth the increased risk? To answer this question, I calculated the Sharpe Ratio for each fund.
The Sharpe Ratio is a metric developed by Nobel laureate William Sharpe that measures risk-adjusted performance. It is calculated as the ratio of the excess return over the volatility. This reward-to-risk ratio (assuming that risk is measured by volatility) is a good way to compare peers to assess if higher returns are due to superior investment performance or from taking additional risk. On the figure I also plotted a red line that represents the Sharpe Ratio of IEF. If an asset is above the line it has a higher Sharpe Ratio than IEF, which means it has a higher risk-adjusted return than intermediate-term treasury bonds. Conversely, if an asset is below the line, the reward-to-risk is worse than IEF.
Some interesting observations are apparent from the plot. Over the past 5 years, municipal CEFs have had excellent performance, handily beating both IEF and MUB. The CEFs are packed into a relatively small area of the reward-to-risk plane. MVT and MUC had the best risk-adjusted performance with BLE close behind. The performance of the other CEFs lagged slightly but still generated impressive results when compared to the municipal bond ETF, MUB. These results are not too surprising. With the exception of 2013, municipal bonds were in a bull market, which favored leveraged products.
As you may have noticed, all the selected CEFs were from BlackRock. Therefore, I wanted to see if you received any diversification by investing in multiple BlackRock offerings. To be "diversified," you want to choose assets such that when some assets are down, others are up. In mathematical terms, you want to select assets that are uncorrelated (or at least not highly correlated) with each other. I calculated the pair-wise correlations associated with the selected funds. The results are provided in the 5-year correlation matrix shown in Figure 2. I was somewhat surprised to see that these CEFs were not very correlated. Most of the correlations were in the 40% to 60% which indicates that you do receive the benefits of diversification if you invest in multiple CEF funds.
(click to enlarge)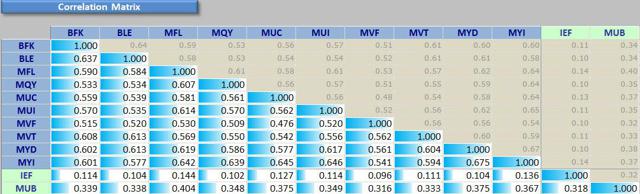
Figure 2. Correlation Matrix Over Past 5 Years
I then combined these 9 CEFs into an equally weighted portfolio. The portfolio has an average distribution over 6.5% tax-exempt, which satisfies by desire for high income. However, I also wanted to assess the risks. The risk versus reward of the combined portfolio is shown as a "red dot" on the figure. As you can see, the combined portfolio had a volatility that was less than the constituent volatilities. This is an illustration of an amazing discovery made by an economist named Markowitz in 1950. He found that if you combined certain types of risky assets, you could construct a portfolio that had less risk than the components. His work was so revolutionary that he was awarded the Nobel Prize. Over the past 5 years, this CEF portfolio had excellent performance and substantially outperformed both IEF and MUB on a risk-adjusted basis.
Next I wanted to assess if the outperformance continued into more recent times. I re-ran the analysis over the 3 years from April 2011 to April 2014. The results are shown in Figure 3. The relative performance was good but not quite as impressive as the 5-year period. MUC, MVT and MYI led the muni pack. MUI and MFL had risk-adjusted performance the same as IEF. Again, all the CEFs handily beat MUB on a risk-adjusted basis but it should be noted that MUB had the least volatility of all the muni funds. The equally weighted portfolio still exhibited outstanding performance over the 3 year timeframe.
(click to enlarge)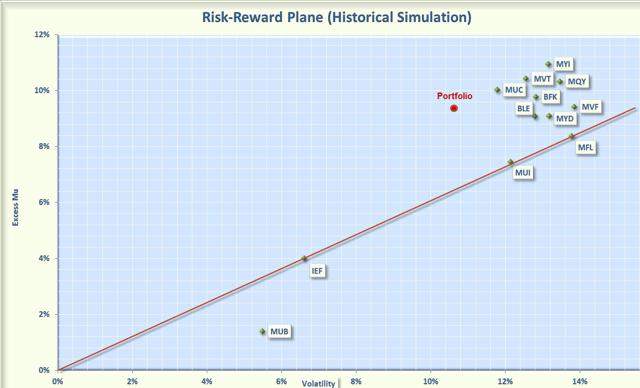
Figure 3: Risk Versus Reward Municipal CEFs Past 3 Years.
The investment landscape became even murkier in the more recent past. Since early last year, the fear of rising rates took its toll on muni bond funds. The worst of the sell-off appears to have run its course and muni CEFs are beginning to recover, but are still well below their levels 12 months ago. To see how this bear market has affected reward versus risk, I re-ran the analysis with a 12-month look-back period. The results are shown in Figure 4. As you would expect, the outcome was not pretty, with all the funds booking negative returns over the period. Sharpe ratios are not useful for negative returns but the chart does show that both the ETFs (MUB and IEF) outperformed most of the CEFs. For the CEFs, MUI and MYI had the best returns.
(click to enlarge)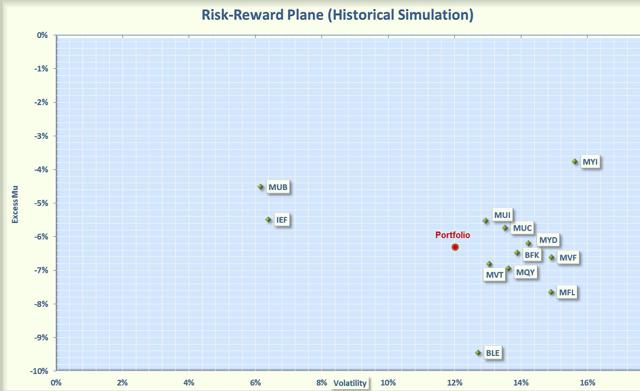
Figure 4: Risk Versus Reward Municipal CEFs Past 12 Months
Does the recent sell-off represent a buying opportunity for muni-CEFs? Only time will tell but I believe these CEFs deserve serious consideration in taxable accounts. With the exception of last year, combining the CEFs into a tax-exempt portfolio has generated good risk-adjusted returns with moderated risks. If you would rather select individual CEFs, I liked both MUC and MYI.
COMMENTS
Comments (6)
Track new comments
-
The default rate on Muni bonds has always been sensationalized by the media. I won't mention the name of the lady who drove the muni market down a couple of years ago on a totally bogus call. She should have her licensed revoked in my humble opinion.
According to Moody's, investment grade bonds in 2013 had 23 defaults out of 21,523 for a default rate of .107%.
Here is a link to the data:
http://bit.ly/1msnBnzSpeculative grade muni bonds defaulted at a 2.1% rate. Most CEFs are limited so that no one bond can be more than 2% of the portfolio so the risk of a bond default effecting the fund is miniscule.I have invested in Muni CEFs for years and have watched them sell off due to media hype when the market is perfectly fine. I sold and bought back again when they hit bottom. I am typically a buy and hold investor but these muni moves are predictable. When you hear the media spewing bad press about munis your sell. When they go quiet you buy.Thank you for another interesting article John.
-
Jetbear,
So do your try and build sort of a ladder fund of CEF muni's? Holding for that long term gain/loss while collecting the dividends? I have been playing these funds for some time and see the same sort of thing that you are talking about. To go off topic do you also go in to CEF's that hold BDC's?
-
I choose my muni CEFs based on discount and yield and make certain it is diversified across states and types of bonds. I never buy a fund that doesn't have at least $250M in assets for liquidity purposes. I typically own from 3 to 7 funds. It doesn't have to be any more complicated than that in my opinion.
I have been looking at BDCs and MLPs but don't own any at this time. Some of my CEFs do hold MLPs in their portfolio such as SCD. It may hold some BDCs as well.
-
Interesting work, and comments. I'm holding some of your findings. In my muni portfolio. True last year was tough, but if you believed in such a portfolio, as I do, you did some tax loss harvesting. That seemed to work last year well before Nov. of 2013. I bought some funds back after the thirty day rule.They have been doing very well since.
You have to remember what fear was being spread all the way from the presidential elections to Buffet dumping muni's to Meredith Whitney's comments state budgets ect.. But look at those funds now. A Portfolio made up of cef muni's is a nice way to offset MRD's for IRAs for those getting close to 70. It give a flexibility to help offset taxes. You can take money out of the IRA and pay the taxes now and set up a muni fund to lower those MRD's in the future. The fund can be used as a device or a bucket to help if you a down year in your IRA. We will not always have years of gains like the last couple in the market. Tax free is a great help. The one nice part is that those dividends don't hit you on the AGI of your 1040. Like any other fund you do have to monitor them. But that tax effective dividend rate helps.
-
You cannot consider a municipal CEF without factoring in leverage. Current leverage costs are low but the threat to increase short rates means a threat to dividends and capital. I am not saying that is coming, just that the risk of permanent capital loss is quite high if one believes higher rates are in our future.
There are a few unleveraged muni CEFs, ,like NNY, but they are older with high coupon bonds rolling off.
It is wiser to own both funds( including open-end funds)and individual bonds if you can do your homework. Each has their good points. Open end funds allow for internal compounding not easily accomplished with efts, cefs, and individual bonds.
But there too you get a perpetual portfolio of usually longer duration. Unlike the treasury market most muni debt is long as it funds long dated assets so funds have to where the yield and supply are located. - Visit Seeking Alpha to comment


