Robert S. Keebler for Ultimate Estate Planner writes: In the world of finance, “Alpha” is often referred to as the value a money manager generates by exceeding a particular benchmark. In the world of financial planning, Tax Alpha® is best defined as the value financial advisors add by reducing the tax burden on portfolio income – “After all, it is what you keep not what you earn that counts.” A thorough knowledge of the intersection between tax and finance will allow an advisor to substantially reduce a client’s overall tax burden. The heart of Tax Alpha® for most clients is bracket management, IRA and other deferral strategies, DrawDown strategies, and “asset location.”
Bracket Management
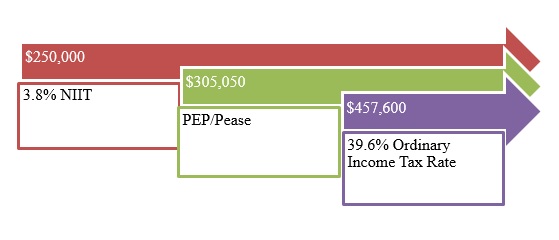
With the introduction of the 3.8% net investment income tax (NIIT), the 20% capital gains rate, the 39.6% income tax rate, and the PEP and Pease limitations in 2013, America shifted overnight from a two dimensional federal tax system to a five dimensional system. Virtually every financial decision now needs to be analyzed through the lens of the regular income tax, the AMT, the NIIT, the new additional brackets for high income taxpayers (the “supertax”), and the PEP and Pease limitations. The complexity of going from a two dimensional system to a five dimensional system is exponential, not linear, and requires a quantum leap in tax analysis methodology, tax strategy and tax planning software tools.
2014 Federal Income Tax Rates and Brackets
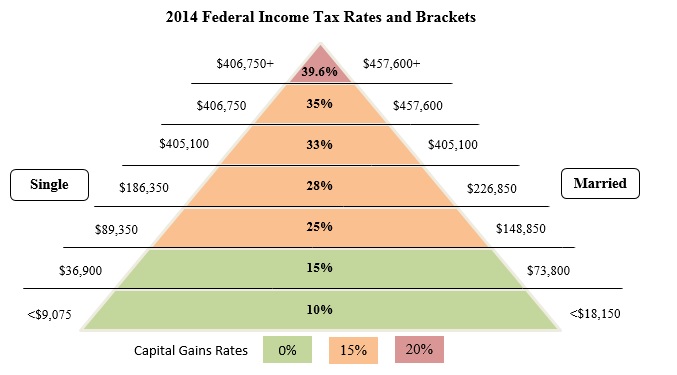
There are now seven different ordinary income tax brackets – 10%, 15%, 25%, 28%, 33%, 35%, and 39.6%, and three different capital gains tax brackets – 0%, 15%, and 20%. Furthermore, if you combine these tax brackets with the new 3.8% NIIT, there are even more possible tax brackets; i.e., high income taxpayers will be subject to a 43.4% tax rate on ordinary investment income and a 23.8% tax rate on long-term capital gains. Lastly, when taking into account the phase-out of personal exemptions (PEP) and limitations on itemized deductions (Pease) as income rises above the applicable threshold amounts, the tax rates increase even further.
2013+ Adjusted Federal Tax Rates
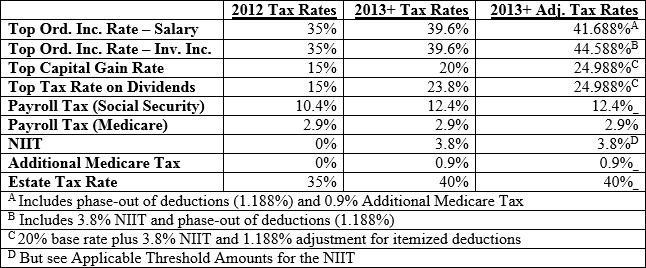
The tax increases that went into effect at the beginning of 2013 highlight the growing realization among investors that it isn’t what you earn that counts, but what you keep after taxes. The prudent investor carefully plans to reduce the drag of taxation on investment performance by analyzing financial decisions through the lens of the new dynamic.
The first step in tax planning is to estimate the amount of taxable income over a five to fifteen year horizon. This longer time frame is desirable given the increased progressiveness of the tax code. Once the amount of taxable income is estimated, planning to avoid the higher tax brackets and the NIIT can begin. There are many different specific tax planning strategies that can be implemented depending on the situation. Some of these include:
- Harvesting losses in high income years;
- Harvesting gains in low income years;
- Contributing to traditional IRAs in high income years;
- Contributing to Roth IRAs in low income years;
- Investing in tax deferred annuities;
- Creating different types of charitable remainder trusts;
- Creating charitable lead trusts;
- Engaging in installment sales;
- Engaging in life insurance strategies;
- Implementing Roth IRA conversions;
- Creating family trusts.
While some of those tax planning strategies may be quite complicated, the basic idea is simple – use income smoothing to obtain the maximum benefit of tax rate arbitrage. Basically, income smoothing strategies involve: (1) reducing taxable income in high income years by maximizing deductions and shifting income to lower income years; and (2) increasing income in low income years by deferring deductions and increasing taxable income to fill-up the lower tax brackets. Put another way, the idea is to “fly below the radar”; i.e., to keep taxable income below the 3.8% NIIT applicable threshold level, and if that is not possible, to keep taxable income below the PEP and Pease applicable threshold, and if that is not possible, to keep taxable income below the 39.6% tax bracket.
Many these income smoothing strategies also create tax deferral – which is also quite powerful in of itself. The longer the period of time that tax can be deferred, the smaller the present value of the tax owed. Below is a chart showing the present value of a dollar of tax paid for various deferral periods, assuming a discount rate of 5%:
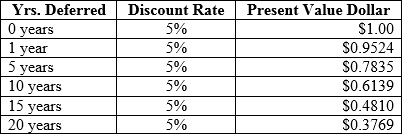
Unfortunately, deferring the entire amount of tax for a certain period of years as shown in the chart above may not be possible. Even if the full amount of tax payable cannot be deferred until the end of the period, impressive tax savings can still be achieved by spreading the payments out over the applicable time period rather than paying all the tax at the beginning of the period.
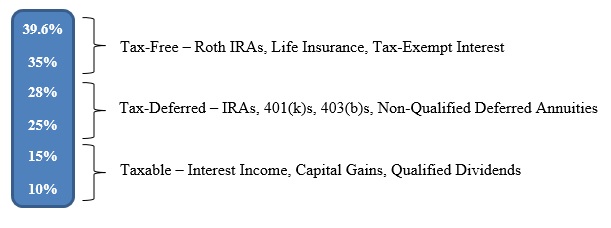
The types of securities and accounts used in the tax aware investor’s portfolio will shift according to the level of the investor’s tax burden. As the income level increases, the complexity of the tax strategies increases accordingly.. Investors in lower brackets enjoy income from bonds under priced for their tax burden and, furthermore, capital gains are tax-free to the extent the of the 15% bracket. Medium bracket investors, who expect their rates to decline will shift income to later years and achieve tax deferral. Taxpayers in the highest brackets will seek statutory tax shelters, even if it means accepting a lower pre-tax return. The following chart shows the type of income or statutory tax shelter taxpayers will seek depending on their marginal rate:
Deferral and IRA Strategies
Gain is taxable only if it is both realized and recognized. There is a realization event if a taxpayer receives or loses something of monetary value. Realized gains or losses are also recognized unless they are subject to a non-recognition provision in the Tax Code. One such non-recognition provision applies to a sale of assets inside a qualified plan or IRA. Although gain is realized, it isn’t recognized. No tax is payable by the taxpayer until distributions are received.. .
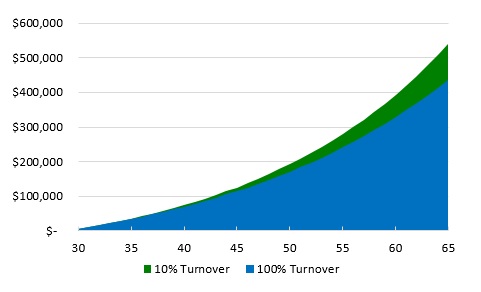
To illustrate the value of managing recognition events and creating tax deferral, compare a taxable investment account with 10% turnover to a taxable account with 100% turnover:
Assumptions:
- Beginning Age: 30
- Ending Age: 65 (i.e. retirement)
- Annual Contribution (Age 30 – 65): $5,000
- Long-Term Capital Gains Tax Rate: 15%
- Short-Term Capital Gains Tax Rate: 25%
- Annual Income/Growth Rate: 6%
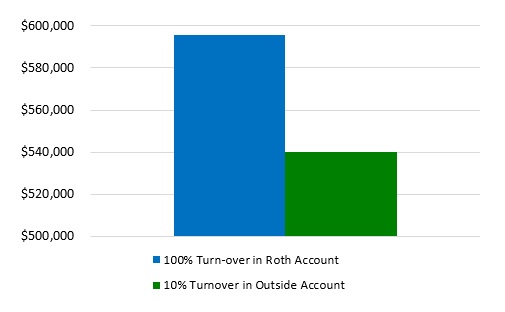
Now, to illustrate the value of the lack of tax recognition events within a Qualified Plan or IRA and to calculate the value of tax deferral, compare a taxable investment account with 10% turnover to a Roth IRA account with 100% turnover:
Assumptions:
- Beginning Age: 30
- Ending Age: 65 (i.e. retirement)
- Annual Contribution (Age 30 – 65): $5,000
- Long-Term Capital Gains Tax Rate: 15%
- Ordinary Income Tax Rate: 25%
- Annual Income/Growth Rate: 6%
Clearly the savings afforded by certain sections of the tax code offer significant opportunity for the tax-aware investor. Deferral is powerful when growing a portfolio. However, its power is even more impressive when retirees carefully manage distributions from retirement plans.
The first step in managing draw down years is to make a 5-15 year tax bracket projection. This is critical because it establishes a benchmark to weigh options. Knowing future potential marginal tax rates allows for informed decisions about when to take distributions and when to make Roth Conversions. To demonstrate how to estimate a taxpayer’s future marginal rate consider the following example:
Assumptions:
- Projection Age Range: 65 – 80
- Single
- State Tax Rate: 0%
- 2014 Traditional IRA Balance: $3,000,000
- IRA Growth Rate: 5%
- 2014 Interest Income: $50,000
- 2014 Social Security Benefits: 25,000
- Real Estate Rental Income: $20,000
- Annual Inflation Rate: 2%
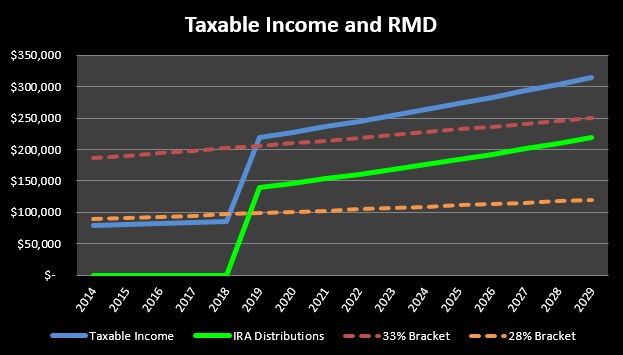
Compiling and projecting the data reveals that, despite the client’s modest investment and social security income, required minimum distributions drive the marginal rate up to 33% during retirement.
Now it’s clear that accelerating income into the early years of retirement, by making Roth Conversions for example, will likely be very effective provided it does not cause the applicable rate to exceed the 33% bracket.
Drawdown Strategies
The more applicable question for most is, however, which account to draw annual living expenses from– a Traditional IRA, a Roth IRA, or a taxable account. Moreover, some will have the exponentially more complicated decision of having to consider life insurance, annuities, deferred compensation, and stock options.
Tremendous value can be added by carefully analyzing the tax implications of the various options. For many clients, the key will be to minimize income exceeding the 15% tax bracket and prevent large fluctuations in income from year-to-year. Income can be minimized by, for example, delaying distributions from pre-tax qualified plans and instead selling high basis capital assets for cash flow. In early retirement years, such strategies can be overwhelmingly effective.
To demonstrate the effectiveness of the distribution management strategy cited as an example, consider a 60 year old retiree in the 25% marginal tax bracket who requires an additional $7,500 for living expenses. The retiree has the choice of: (1) distributing $10,000 from a Traditional IRA to meet the shortfall or (2) selling stock in a taxable brokerage account with a basis equal to its fair market value of $7,500. The following chart shows that keeping the funds in the IRA will result in less taxation than even a taxable equity investment with completely deferred taxation of the growth.
Assumptions:
- Projection Age Range: 60 – 80
- Filing Single
- Stock/IRA Growth Rate: 5%
- State Income Tax Rate: 0%
- Federal Ordinary Income Rate: 25%
- Federal Capital Gains Rate: 15%
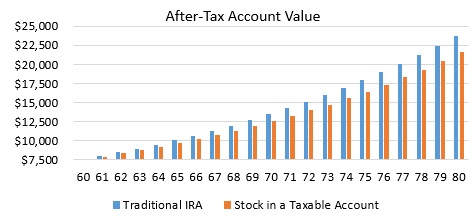
Note that this chart compares the after-tax value of each account if allowed to grow rather than being liquidated.
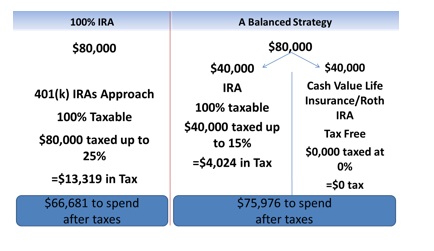
However, the opportunities to give such long-term strategic advice to clients rarely presents itself compared with opportunities to provide tactical advice about how to manage draws in a particular tax year. Nevertheless, such tactical advice can be equally, if not more effective. For example, balancing retirement draws from accounts which generate taxable income and those which do not, can significantly decrease the amount of wealth consumed annually or allow for greater spending. Consider a retired single taxpayer who has not yet started social security and is comfortable drawing $80,000 from savings for living expenses, but is unsure which accounts to draw from. Note the tremendous amount of tax saved by balancing draws in order to avoid the higher income tax bracket:
Tax-Aware Investing
Taxes are often a bigger drag on performance than management fees or commissions and over time can dramatically inhibit wealth accumulation. In my next article I will focus on tax-aware investing.
RELATED EDUCATION & PRODUCTS
Below is a list of a number of educational programs and products that relate to this topic that you might be interested in:
- The Advisor’s Guide to The Top 25 Tax Planning Ideas for 2014 – By Robert S. Keebler, CPA, MST, AEP (Distinguished)
- Personal Exemption Phaseout & PEASE Impact (PEP-PEASE) Chart
- Bracket Management Chart
- DrawDown Strategies Chart
To contact the author Robert S. Keebler, CPA, MST, AEP , CGMA click here Keebler & Associates, LLP
0 comments:
Post a Comment