(Lance Wiggs is an independent investment and business advisor providing investment readiness consultancy through Better by Capital and Return on Science investment committees, direct investments through LWCM and Punakaiki Fund and advice and directorships through LWCM and Lance Wiggs Consulting. I write here and have a Q&A column in Idealog).
Lance Wiggs writes: Tracking the performance of the 1 hour Xero model.
DISCLOSURE: I hold Xero shares.
Last year I built a very quick and dirty spreadsheet to analyse Xero, and wrote Valuing Xero – in one hour. The article was cross-posted to the NBR, where it attracted far more comments. More on those comments below.
I used Xero’s September 013 earnings release (and only that earnings release) to feed the spreadsheet and to try to keep things simple. It was not meant to be a valuation – just a chance to show how simple it is to create a model from very little information.
With the recent release of Xero’s September 2014 results, it’s time to revisit.
I’m not an official financial advisor, and you should make your own counsel and seek advice before investing. I do urge you do do your own numbers, regardless of any external advice that you get. Also understand the difference between placing short term bets against market movements by traders and long term plays based on intrinsic business fundamentals. I, for example, generally buy and hold investments, whether public or private, as that allows the investment value to reflect long term results rather than actions of other market participants.
1: How did I do?
Lousy. I made a basic formula error in the spreadsheet, discovered by the ever-present Anonymous at NBR. Well done to him or her, and brickbats for me.
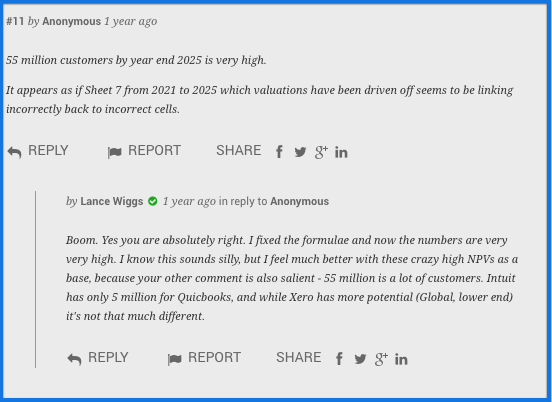
That formula error transformed the model dramatically – from showing that Xero’s value was $2-8 billion to showing that it was several times larger. Here’s what I said a bit later in the comments:
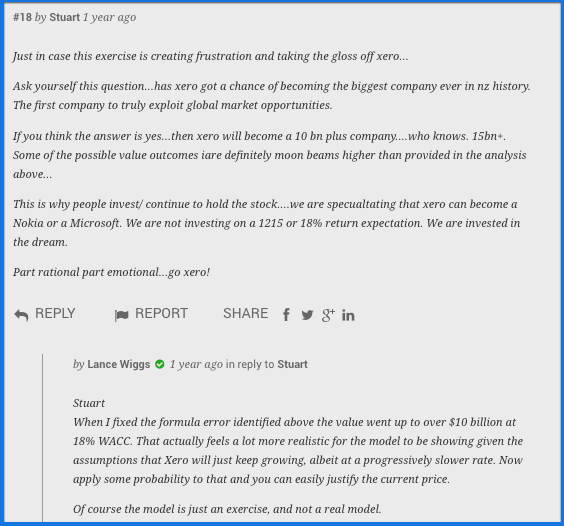
I agreed with the comment that Xero has a shot at being New Zealand’s biggest company ever by market capitalisation, and correcting the formula error did give me a lot more comfort that the model was working.
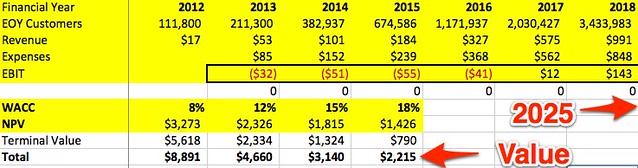
The error in the spreadsheet was at the final step, which I had clearly rushed in my haste to deliver the result within my own time limit. The summary table showing the customer numbers and the annual revenue and expense results had some incorrect references in the later years. These latter two were summed to calculate the annual EBIT, which was used to calculate the Net Present Value of Xero’s EBIT. One error (customer numbers) was a typo, and was just visual, but the other error meant that the profit in the last few years and hence the terminal value were well under-reported. Here’s what the error looked like:
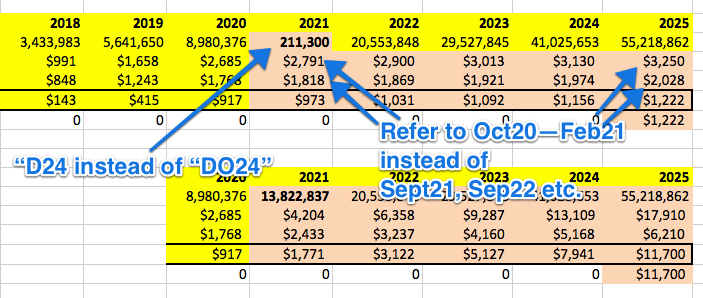
The cells were each summing up 12 months worth of data, and I had simply not completed the line for revenue and expenses. The most embarrassing is the cell showing the sudden drop in customer numbers (2021 was going to be a bad year), as it looks so obvious.
In a real model I would generally have a large number of charts showing the trends, and when constructing models I often create then delete charts just to make sure the numbers are making sense. Here’s the chart that I should have created:
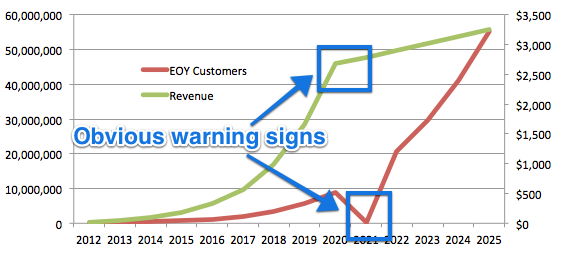
But I did not, and so the difference was embarrassingly large.
The first bottom line (Total value of Xero) showed total values of between $2.2 and $8.8 billion, depending on the discount rate. (I tend towards 12-15% but you can pick and choose).
Before fixing the error:
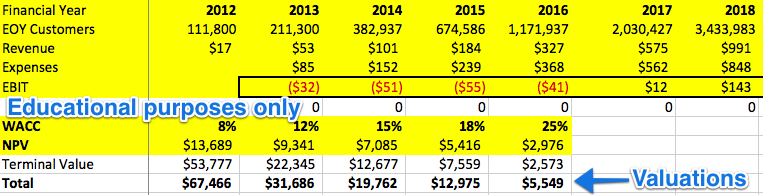
After fixing the error:
The amended version shows valuations from $13 to $67 billion with the same discount rates, and $5.5 billion at 25% – placed there for Anon (comment 16 on NBR) who wrote that “This remains a venture capital play and I would suggest a WACc closer to 25% would be justified, especially for investors with limited exposure to high risk transactions.” What anon is saying is that he or she believes that there is considerable uncertainty in the future of Xero and that investors should demand higher returns.
The error undervalued Xero by a substantial margin.
However there were a number of other corrections suggested to the model, such as salary rates, checking the number of customers in the out years, key man risk for Rod Drury, validating versus value of incumbents that Xero is attacking, tax, inflation, capex and so on. Many of these would depress the value, but none would do so in a material way versus this simple error. At least the error was in the right direction, and it goes to show that sometimes it does pay to read the comments – even in the NBR.
2: Apart from the error, how did the model hold up?
The good news:
The model (these numbers were the same in the corrected one) projected an annualised runrate as at the end of September 2014 of NZ$131.6 million. The actual reported number was almost exactly the same at $132.3 million (both round to $132 million). That’s very good.
The number of paying customers at the end of September was projected to be 383,000, but was delivered at 371,000, 3.2% under my forecast. I’m taking that as a win as it is within any reasonable margin of error, especially as the number had increased by 75.5% versus the year before.
The operating revenue for the six months was reported as $54.3 million, while the subscription revenue was $52 million, splitting these two out for the first time. The 2013 forecast showed $58.2 million, so the result ($54.3m) was 6.7% lower. But wait – Xero also reported that their subscription result in constant currency was $56.2 million, which is just 3.4% away from the actual. So I’ll take that as a win as well, however it’s clear that the model is now out of date and I need to adjust for the break out of subscription revenue.
It would also be nice to model the effect of currency on Xero’s results, but I’m probably not going to do that just yet. Over time the foreign-derived income will increase and provide a natural hedge for offshore costs.
The changes:
The material changes have been in the regional results – shown here by number of customers. The North America result was lower than expected, casting doubts in many people’s minds about whether or not Xero is going to win in the USA.
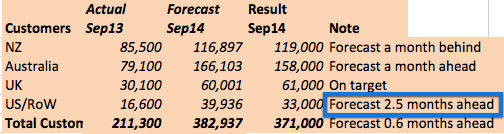
I’m not going to change my own position, which is that Xero will grab a substantial share of the US market, and that what we are seeing is standard for SAAS subscription companies. They seem so slow in the early years, but the effect of compound growth is that over time the numbers start getting huge. While the forecast numbers may seem a long way from a result, in reality the growth is so high that the forecast is usually just a month or two early or late. The overall number of customers, for example, was 13,000 over-forecast, but that represents just over half a month’s worth of net new customers. It’s similar to the classic lily in a pond that doubles in size each day – the lily covers just half the pond on the penultimate day.
However the US/Canada and rest of world total missed by a larger margin – 2.5 months or 17.4%. Most of that growth came from the US market, which is now broken out showing growth from 10,000 to 22,000 in the 1 year from September 2013 to September 2014.
Xero did not report annualised revenue run rates by region, which is a pity. They did report total revenue by country for the six month periods to September 2013 and 2014 though. Here’s how the forecast (middle column) performed versus the result – only the NZ result was close, but given the adjustments above (currency, split out) it was probably a tad high while the Australia/UK growth were closer that shown.
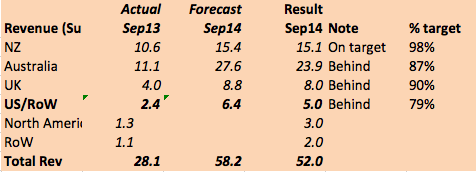
The forecast was working hard here from the limited 2013 information, and it’s clear that some adjustments are required.
3: Summary
Here’s the file: 2013 spreadsheet with fixed formulae and comparisons. Please handle with care.
I’m very happy with how the model performed, but it’s also clear that it can be improved with the new information from Xero and by making some changes in assumptions in reaction to the comments. I’ve started doing this but am not sure whether I will continue – there is too much work to do. The model is ridiculously simple and still a long way from a proper financial model – so tread with absolute caution, and watch out for errors.
On Xero
I remain firmly of the opinion that Xero is destined to be a giant, and we should ask of Xero (and every recurring revenue company) not “Why will the growth continue?” but “What would make the exponential growth slow down or stop?“
It’s clear that in New Zealand the growth is slowing – is this because Xero is hitting the end of the addressable market, or will we see slower adopters steadily coming across? What are the month to month additions and churn rates for the North American market, and when will we run out of customers in the Australian and UK markets? Xero addressed some of these questions in a recent release, and I intend (no promises as above) to adjust the model to take these into account.
Overall it’s a timing question – I remain confident that Xero will hit, say, $1 billion in revenue, but the question is when. The unadjusted model suggests that this particular benchmark would be close to happening in FY2018, but that will certainly slip a year or two once I make some reasonable adjustments. But does it really matter when $1 billion revenue occurs? Xero is clearly a monster in our midst.
Parting shot to another anon from last’s year’s NBR article – who was of course proven correct almost instantly.

Such a very useful blog. To get quick and easy IRS 1099 MISC Form Online issues, then talk to our experts. 1099 MISC e file
ReplyDeletedirectly.Mail Us support@taxseer2290.com For Sales Inquiries 240-780-6153